


Network Protocol Analyzers
Overview
In this tutorial, you will first learn how to use tcpdump and ethereal, which are two well-known network protocol analyzers. These tools capture and display traffic that can be picked up by a network interface card. Only traffic transmitted by the systems connected to the same Ethernet hub is captured. The goal of this tutorial is to learn the basic features of these tools in order to capture and analyze network traffic. This tutorial is used in Network Security TELECOM 2821.
Required Equipment
Two Linux machines, which can be found in the SIS labs. You can use Linux PC: Millennia (IP 192.168.30.51) or PC1 and Linux PC: Pigeon (IP 192.168.30.52) or PC2. Since both tcpdump and ethereal commands need to be run as root or permitted users, you will use the command sudo to allow a permitted user to execute these commands.
Login Instructions
To access both machines or execute the programs, use the following username and password.
TCPDump
TCPDump is a command-line network analyzer program. It prints out the headers of packets on a network interface that match a Boolean expression. TCPDump has a rich expression syntax that allows you to select only the packets you need to view to troubleshoot your problem. Please refer to TCPDump man page for the usage.
- In a terminal window on PC1, type in the following command and observer the output.
$ sudo tcpdump -n -i eth0
- Listen to the traffic from PC1 on PC2 by using the following command. You maybe required to enter the password. If so you should see tcpdump: listening on eth0 if the command was successful.
$ sudo tcpdump -n host 192.168.30.52
- On PC2, issue a ping command to PC1 for 5 packets. Observer the output, and use Ctrl-C to quit tcpdump, but do not close the terminal window.
$ ping -c 5 192.168.30.51
- The previous command executed on PC1 will capture all datagrams. To filter packets, on PC1 open a new window and type the following:
$ sudo tcpdump -n not \icmp and host 192.168.30.52
- On PC2, ping PC1 with 5 packets and observer the output. After you are done you can quit TCPDump. Use the following command to ping PC1.
$ ping -c 5 192.168.30.51
- On PC1, execute the command, which will save the tcpdump output to a file in your local directory..
$ sudo tcpdump -n host 192.168.30.52 -l | tee file_name
- Open another terminal window and initiate an FTP session to PC2 by issuing the following command.
$ ftp 192.168.30.52 with username tel2821 and the password sniffer.
ftp> cd NetSec
ftp> get tcpdump.txt
ftp> bye - If the NetSec directory or the file tcpdump.txt does not exist, you can create a new one.
$ man tcpdump | col -b > tcpdump.txt
- At PC1, quit tcpdump and print out the tcpdump output file. You need to save it on a floppy disk or other removable media. You will also need to print out and attach the output to your lab report.
Questions
- What are the -n and -i options? (you can refer to the man pages for more details.)
- What is the difference between the output in step 3 and that in step 4?
- Based on your output, what are the port numbers of the FTP client and the FTP server?
Ethereal
Ethereal can recognize a number of protocols that has a graphical-user-interface, which allows you to analyze captured traffic much easier then TCPDump. Ethereal displays traffic information using three windows. The top window shows the summary of the captured packets. The details of packet headers can be viewed from the middle window and the bottom window shows packet content in hexadecimal and ASCII representation. The following steps show how you can capture and view the content of the packets.
- On PC1, run the ethereal command by using the following command.
$ sudo ethereal
- To set the capture filters, on the menu bar click Capture then Start.
Select eth0 in Interface.
Select Capture packets in promiscuous mode.
In Filter, type host192.168.30.51 and host 192.168.30.52.
Select Update list of packets in real time.
Select Automatic scrolling in live capture. -Unselect three Enable name resolution checkboxes and click OK. - Open a terminal window on PC1, initiate an FTP session to PC2 using the same process as step 5 from TCPDump. Transfer a file and quit the FTP session.
- On the ethereal top window, select any TCP packet. Right-click that line and then select Follow TCP Stream.
What do you see? Write down only the lines related to username and password exactly as they are shown. What is the filter expression at the bottom of the ethereal window, next to the label filter? This is also called the dispaly filter since only the traffic that matches the expression is displayed.
- To write your own display filter, press the Reset button to remove the existing filter. Then type a filter expression in the field and press Enter. You can use an interactive help-window for writing display filters. The following example will show you how to write a display filter to display TCP headers with the SYN flag set.
Click the Filter button or click Edit on the menu bar, and then select Display Filters.
On the pop-up window, click Add Expression, then select TCP: Syn
Select "= =" in Relation
Set the value (Boolean) to 1
Click Accept and the filter string will be shown.
Your filter string: _____________________________
Then click Close. - Press the Reset button on the bottom. Type the filter expression obtained in step 6, and then press Enter.
Questions
- How many TCP headers with SYN flag set are shown in the window?
- Write syntax for the following display filters.
- A display filter that shows IP datagrams with the source IP address of PC2.
- A display filter that shows packets containing TCP segments using the destination port 23.
- A display filter that shows IP datagrams with length greater than 400 bytes.
Sniffer Distributed System
In the previous sections, you learned how to use TCPDump and ethereal. In this section, you will explore a commercial packet sniffer called the Sniffer Distributed System (SDS). The SDS is a centrally managed, client-server network analysis system that allows users to monitor, analyze, and troubleshoot networks. The SDS comprises of two main components, which are the console and agent. The SDS agent is responsible for capturing packets and collecting statistics from the networks in real time. The SDS console acts as a network management center that connects to the agents and later displays the captured data in a user-friendly fashion. In this section, only the traffic transmitted on an Ethernet LANs is captured and analyzed. The goal of this section is to learn the basic features of the SDS in order to capture and analyze traffic related to network security.
Required Equipment
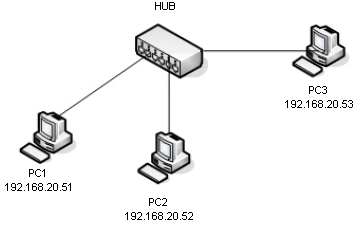
Two Linux machines, which are found in the SIS computer lab. You can use Linux PC as a client : Millennia (IP 192.168.30.51) or PC1 and a Linux PC as server : Pigeon (IP 192.168.30.52) or PC2. You will also need a Windows NT PC that will act as the sniffer/attacker, which is SniffServ4(IP 192.168.30.53) or PC3. Finally you will be using a 10/100 Ethernet Hub.
Login Instruction
To login PC1 and PC2 use the following username and password.
- Username: tel2821
- Password: sniffer
Telnet and SSH
Telnet Session
In this part, you will use the SDS to capture the Telnet session between PC1&PC2 to show that the Telnet protocol does not deploy a secure login technique.
- On PC3, click Start> Programs>Distributed Sniffer Pro>SniffView.
- Click OK at Enter Console Password window (no need to enter user name&password). SnifferView console will appear.
- To create an agent for capture Ethernet traffic, click Agents>Add. The Agent Wizard will appear.
- Select DSPro in Type box. Enter tel2821agent in Agent Name and leave a blank password. Then click Next.
- Enter 192.168.30.53 in Hostname/IP Address. Click Get Card List and select Network Associates. Inc. NAI21140/UC_2 in drop down list. Then Click Finish. The agent will appear in SniffView.
- Highlight the telnetagent and click Connections> Connect in SniffView. The tel2821agent will be connected to Sniff View console. Sniffer window for the tel2821agent will appear (This will take a few seconds to completely load Sniffer window).
- In this lab, we will capture traffic only between PC1 and PC2. At Sniffer window, click Capture>Define filter.
- Click Address tab, select IP in Address Type. Enter PC1's IP address under Station 1 table and PC2's IP address under Station 2 table on row 1. Then click OK. We are now ready to capture traffic.
- (Note: you may need two people in the step 9-14: one at PC3 and one at PC1& PC2) Click Capture>Start at Sniffer window on PC3.
- Create a telnet session from PC1 to PC2. On PC1, open a Terminal and type:
$telnet 192.168.30.52- Login prompt will appear. Enter login name and password as shown in Login Instruction.
- A welcome message will appear.
- Type exit to close the telnet session.
- At PC3, Click Capture>Stop to stop capture traffic between PC1 and PC2.
- Click Capture>Display. All capture packets in telnet session will appear in Sniffer window.
- Use Scroll bar to find packets that contain all password characters, print out the result using print screen, and attach the result with this lab exercise.
Note: Telnet session always sends each password character as a separate packet. To save you result, press the Print Screen button on the keyboard and paste it into Paint. To open Paint click Start>Programs>Accessories>Paint. Save the file of the Sniffer window to a disk.
Secure Shell Session
Instead of the Telnet session, in this part you will run a secure shell session from PC1 to PC2 and use the SDS to capture the results.
- Verify that the previous section on Telnet has been completed.
- Click Capture>Start at Sniffer window on PC3.
- Create a secure shell session from PC1 to PC2, which is done on PC1 by using the following command: $ssh -l tel2821 192.168.30.52
- Enter the password as shown in the Login Instruction.
- Type exit to close the telnet session.
- At PC3, Click Capture>Stop to stop capture traffic between PC1 and PC2.
- Click Capture>Display. All capture packets in telnet session will appear in Sniffer window.
- Use Scroll bar to view all captured packets, print out the result, and attach the result with this lab exercise.
Questions
- What packets contain the password characters?
- What is the difference between the Telnet session and Secure shell session in terms of what you see with the sniffer?